Guest Blog via AzPHA Member Allan Williams, MPH, PhD
CDC data as of 11/09/23 indicated that nearly 1.2 million COVID deaths (underlying or contributing cause) have occurred in the U.S since the start of the pandemic. In Arizona, 33,788 COVID deaths have occurred according to the COVID dashboard at ADHS as of 10/04/23.
Many COVID deaths could have been prevented had more individuals and public officials followed recommended public health prevention guidelines or had officials not been prevented by legislators from implementing preventative measures or even providing accurate information on vaccines, treatments, and other measures.
As previously noted in the 08/27/23 AZPHA Policy Update, COVID deaths do not reflect the full impact of the pandemic on mortality.
Many other causes of death have also been elevated during the pandemic due in part to delayed or denied access to healthcare, unemployment, and many other factors.
For example, a comparison of just the 15 leading causes of death during 2018-2019 to those causes during 2020-2021 showed significantly increased rates of death for nine of the 15 causes in the U.S .and 8 of the 15 causes in Arizona, including heart disease, accidents, strokes, diabetes, liver disease, hypertension, Parkinson’s disease, and homicides. Other causes such as firearm deaths and opioid overdose deaths also increased.
As has been widely reported, the increased pandemic-related deaths have had a dramatic effect on life expectancy (which assumes current mortality rates were to continue though life). In 2020, life expectancy at birth declined by 1.8 years in the US and by 2.5 years in Arizona compared to 2019. In 2021, life expectancy declined by 2.4 years in the US and 2.8 years in Arizona compared to 2019.
The CDC has tracked overall excess deaths (Table 1) for the U.S. and for each state by week, month, and year. For each time period (week, month, or year) the observed deaths from all causes are compared to the estimated expected number of total deaths had the pandemic not occurred.
Those estimates are based on weekly death data during 2017-2019. It’s important to note that estimates of expected deaths (and the percent excess) are much more accurate for time periods closer to the 2017-2019 comparison period. Thus, the estimated excess would be most accurate for 2020 and least accurate for 2022.
In previous Policy Updates we compared the percent of excess deaths among the states for specific pandemic years. In 2020, the 29% excess of total deaths in Arizona was the highest among the states. In 2021, Arizona tied with Alaska with a 38% excess based on still provisional data.
Final 2021 data, however, indicated that Alaska had a 39% excess, barely exceeding Arizona’s 38% excess. In 2022, provisional data indicate Alaska again narrowly exceeded Arizona with a 27% excess vs a 25% excess for Arizona.
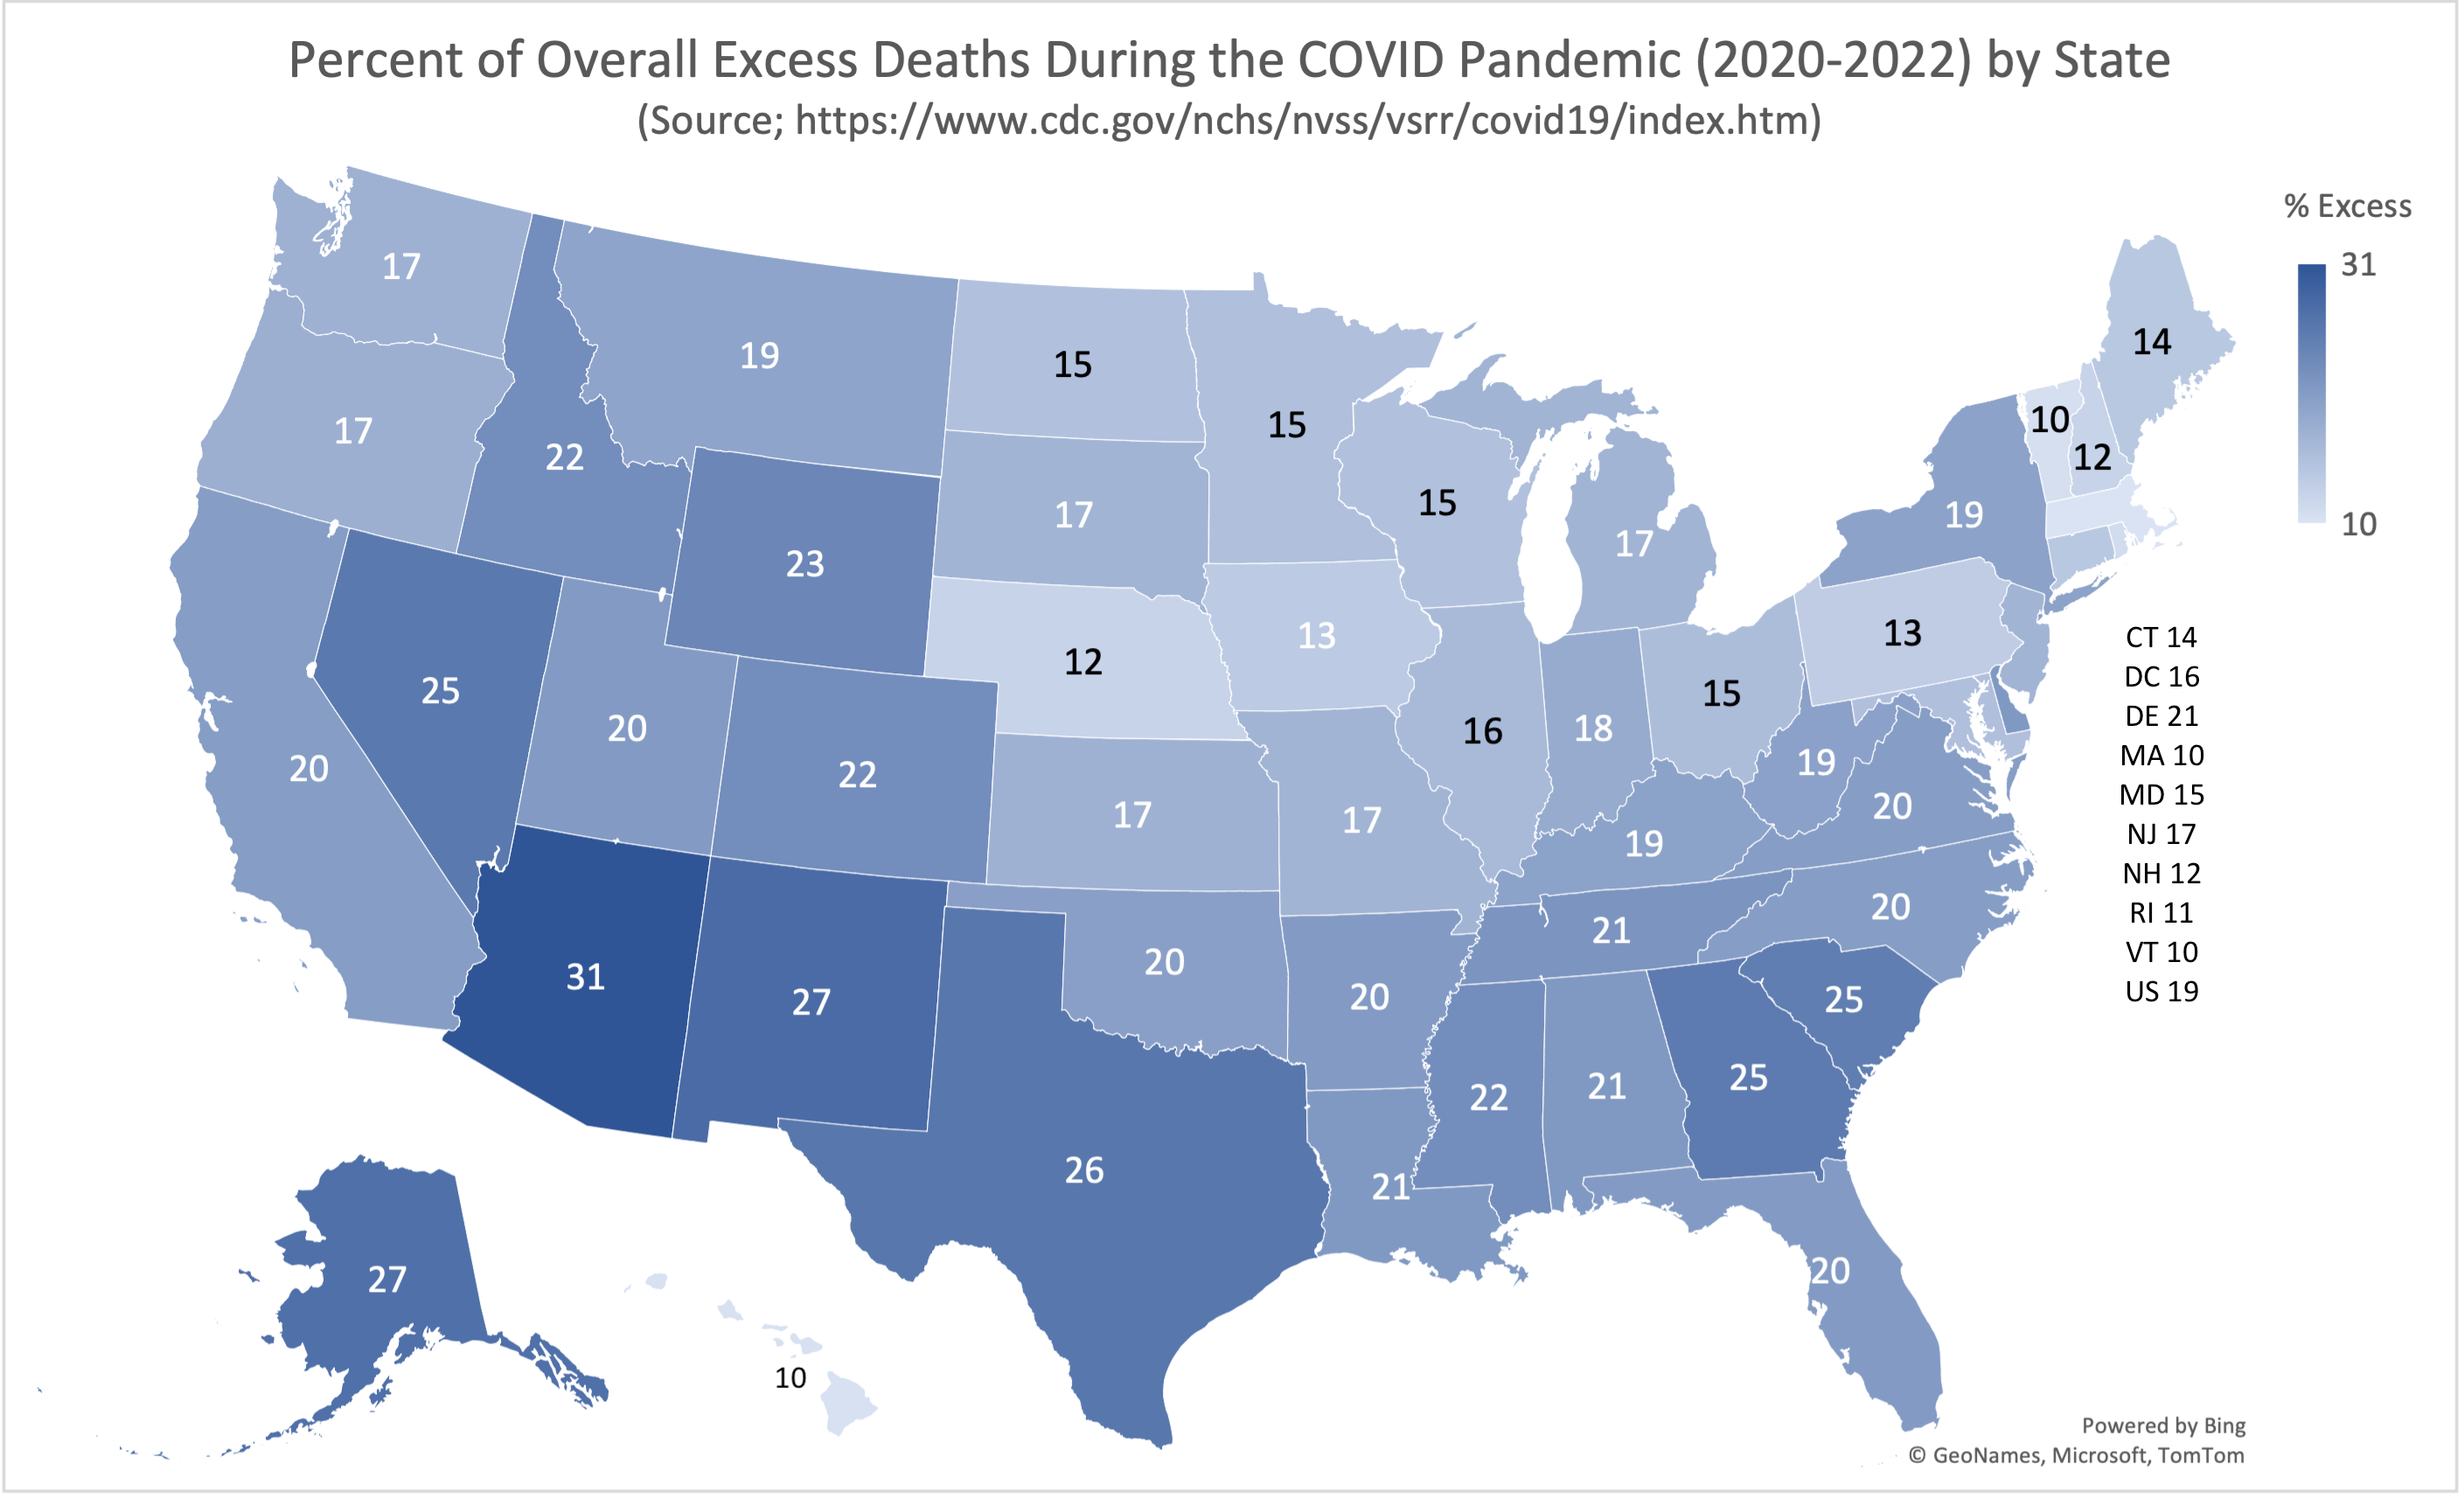
For an overall perspective, CDC data was used to aggregate total observed deaths and expected deaths during 2020-2022 to calculate the overall percent of excess deaths for each state.
As shown in the map above, Arizona led all states with an overall 31% excess deaths in 2020-22. Alaska and New Mexico followed with 27%. Vermont, Hawaii, and Massachusetts had the smallest excesses at 10%.
Based on the CDC estimates of excess deaths, Arizona experienced an excess of 55,000 deaths (including COVID) during 2020-2022.
However, using a slightly different approach for estimating the “expected” number of deaths based on extrapolation of the linear increase in total deaths during 2015-2019 (R² = 0.975, p = 0.002) and on slightly newer provisional data for 2022 yields a higher number of expected deaths and therefore a lower number of excess deaths, approximately 41,000. Wherever the true value lies, both estimates represent a tragic and largely avoidable mortality toll among Arizona residents.
The portion of the excess due to COVID varied widely by state, ranging from 45% to 100+%. For Arizona, COVID represented 53% of excess deaths, while for the U.S. COVID accounted for 68% of the excess.

